×![]()

 All guides
How to automate medical imaging with AI

With AI-powered detection, you can now easily harness the latest advances in foundation models to help accelerate your medical imaging and life sciences operations. AI is being used for a range of features and use cases - from segmentation of medical scans, detection of abnormalities in organs, or classifying cell nuclei for the purpose of predicting diseases like cancer. As the demand for more intelligent monitoring continues to rise, it's essential for teams to improve imaging efficiency, accuracy, and diagnostic capabilities. Labelbox empowers the world’s largest organizations to leverage AI solutions tailored to their unique medical detection challenges.
However, teams can face multiple challenges when implementing AI for large-scale medical imaging detection. This includes:
- Data quality and quantity: Improving medical imaging detection requires a vast amount of data in the form of images, videos, and documents. Orchestrating data from various sources can not only be challenging to maintain, but even more difficult to sort, analyze, and enrich with quality insights.
- Dynamic review landscape: The changing nature and format data from multiple sources poses the challenge for businesses to account for continuous data updates and re-training needs.
- Cost & scalability: Developing accurate custom AI can be expensive in data, tools, and expertise. Leveraging foundation models, with human-in-the-loop verification and active learning, can help accelerate model development by automating the labeling process.
Labelbox is a data-centric AI platform that empowers organizations to transform their medical imaging operations through advanced computer vision techniques. Instead of relying on time-consuming manual human review, companies can leverage Labelbox’s AI-assisted data labeling and flexible training frameworks to quickly build task-specific models that uncover actionable insights.

In this guide, we’ll walk through an end-to-end workflow on how your team can use Labelbox to build a powerful model to improve medical imaging detection. Specifically, this guide will walk through how you can explore and better understand your visual assets to make more data-driven diagnostics on histopathology images.
See it in action: How to automate medical imaging with AI
The walkthrough below covers Labelbox’s platform across Catalog, Annotate, and Model. We recommend that you create a free Labelbox account to best follow along with this tutorial.
Part 1: Explore and enhance your data with Catalog and Foundry
Part 2: Create a model run and evaluate model performance
You can follow along with both parts of the tutorial below via:
Part 1: Explore and prepare your data
Follow along with the tutorial and walkthrough in the Colab Notebook. If you are following along, please make a copy of the notebook.
Ingest data into Labelbox
For this tutorial, we’ll be working with a dataset of histopathology images – with the goal of identifying cancerous regions through visual inspections. These images were taken from the open source PanNuke dataset, first published by researchers at Warwick University. The raw image dataset comes in the form of a numpy array of pixels, and first needs to be converted to jpeg stored as objects on your cloud storage. The steps taken to achieve this can be found in the Python notebooks that accompany this demo.
The first step will be to gather data:
Please download the dataset and store it in an appropriate location on your environment. You'll also need to update the read/write file paths throughout the notebook to reflect relevant locations on your environment. You'll also need to update all references to API keys, and Labelbox ontology, project, and model run IDs
- If you wish to follow along and work with your own data, you can import your data as a CSV.
- If your images sit as individual files in cloud storage, you can reference the URL of these files through our IAM delegated access integration.
Once you’ve uploaded your dataset, you should see your image data rendered in Labelbox Catalog. You can browse through the dataset and visualize your data in a no-code interface to quickly pinpoint and curate data for model training.
Search and curate data
You’ll now be able to see your dataset in Labelbox Catalog. With Catalog, you can contextualize your medical imaging data with custom metadata and attachments to each asset for greater context.
In this demo, we'll be using Catalog to find relevant images of histopathology images for our dataset by taking samples of tissue cells that are stained and subsequently analyzed under a microscope - with trained pathologists identifying cancerous regions through visual inspections. AI models are increasingly being used to perform the visual inspection in order to accelerate this manual and time consuming activity, as well as reduce observer variability.
With Labelbox, you can leverage custom and out-of-the-box smart filters and embeddings to quickly explore product listings, surface similar data, and optimize data curation for ML. You can:
- Search across datasets to narrow in on data containing specific attributes (e.g metadata, media attributes, datasets, project, etc.)
- Automatically find similar data in seconds with off-the-shelf embeddings
- Filter data based on natural language and flexibly layer structured and unstructured filters for more granular data curation.
From the data shown, you can toggle over to the Analytics view within Catalog to understand the distribution of your data better and looking for the number of images relating to each organ. In this specific data set, you can see that "breast" and "colon" datarows are the most common, making up roughly 30% and 18% respectively. For the purposes of this walkthrough, you will select the "colon" datarows, layer multiple filters to arrive at your relevant data, and save this as a slice for annotation, which we'll be covering next.
Create your Annotate project
Now that you have narrowed down your relevant subset of data, the next step is to and set up your Annotate project, which allows you to begin labeling the key objects or classes about an image - in this case it will be the cell nuclei of interest within each image.
In order to understand the various nuclei categories that are present across the dataset, you can observe academic papers that accompany the PanNuke dataset - in the case of Colon organ images, we will look to annotate 5 main categories: Neoplastic, Connective, Inflammatory, Epithelial, and Dead Cell nuclei.
After identifying what we're interested in detecting, you can proceed to create an ontology. When entering your ontology, you can select the segmentation annotation type and then pass data to the project, and attach your ontology and begin tagging. There are various options for segmentation, from pen, to bounding box, to pen and brush.
Annotate your data rows
Now that you have appropriately configured your annotation project with the relevant data and ontology, you can begin to annotate each of your datarows. To do this, a labeler can navigate to the top right and under “Start”, you can select the option to “Start Labeling”.
Doing so will bring up the Labelbox annotate UI, where on the right you will have the datarow of interest, in this case an image of colon tissue, and on the left you can see each of the objects (or nuclei type) included in your ontology. Your labelers can use this to begin marking up each of the objects of nuclei types present in the image.

- In some situations especially in the medical field, you may wish to have your data rows annotated my subject matter experts such as trained pathologists or other medical professionals which may be from within your organization.
- However, if you do not have an appropriate labeling workforce or technical expertise within your organization, you can utilize Labelbox’s Boost Workforce offering. This program offers customers the ability to source labelers through Labelbox with specialized knowledge and skillset required to annotate the features of relevance across your dataset.
It is worth exploring a few of the capabilities available within Annotate in order to perform your task. Labelbox has AI powered solutions embedded in Annotate, that make use of image embeddings to help in suggesting appropriate segment instances
After selecting the object of interest, you can see at the top the various options available:

- The first is the Hover and Click option, which allows us to move our cursor over various part of the image and identify possible segment instances as you can see on the screen in front of you.
- The second option is the Auto Segment Box solution, where we can draw a bounding box around an object of interest, and leverage the segment anything model to automatically generate appropriate segment masks.
- The third option is Brush. This gives you full control control of the segment area by allow us to highlight an area using a larger brush stroke
The effectiveness of the Hover and Click and Segment Anything options will depend on several factors such as the quality and resolution of your images, as well as features in the image such as the definition of object boundaries and brightness of the image. However, in this case we can see that the Hover and Click options leads to good results, so you can go ahead and begin annotating accordingly.
Reviewing your annotations
Eventually you will reach a stage where you have a sufficient number of labeled data rows to begin reviewing. In this instance, you can label roughly 1000 data rows in your batch in the first instance. Reviewing can alternatively be an ongoing activity that is run in parallel to your initial labeling, and the frequency of review is completely dependent on your labeling operations preferences or business logic. To begin reviewing the labeling workforces annotations, a reviewer can simply navigate to the top right and select start "Review".
There are a few options available to your reviewers:

- First of all, you could mark an issue or comment and then reject the data rule (as shown in the image above). This would move the data rule back into a rework bucket where a labeler can review it and see any issues attached before taking remedial action and resubmitting for a second review.
- Alternatively, a labeler may choose to edit the image as part of the review stage themselves directly.
- The third and final option is simply to review the data row, acknowledge that everything seems appropriate and go ahead and approve. This will then subsequently bring up the next data row for review and the processes repeated until all data rows sit within the done bucket. Once in the done bucket, the data can be extracted and used for downstream exercises as training or fine tuning a custom model or deriving business insights from the annotations.
Part 2: Using Model & Foundry to generate pre-labels
In Part 1 of this walkthrough, we covered how to curate medical images and set up your annotation project for initial labeling and review. The next part of this guide will cover how you can extract your annotations for evaluating and diagnosing your model. There are various ways that this can be done; from exporting the data directly within the Labelbox UI to using Labelbox's API to extract the data directly from your project.
We'll be covering first how to set up a model experiment within the Labelbox UI. You can navigate to the model tab and see the tab for "Experiment" here. By creating a new experiment in the top right as shown below, you can name it something appropriate and add a description and select next.

Afterwards, select the ontology that you used in your previous annotate project and then subsequently select the project which your labeled data rows sit within.
You'll see that Labelbox handles the test train and validate splits and suggests by default 80/10/10. You can tweak these by using the slide at the bottom or by editing the percentages shown in the text box. For the purpose of this demo, you'll keep this as standard and create your first model run (as shown below).

After your data has been successfully passed into a model run, you can observe each of your annotations, and on the left hand side, you can see the splits across train, validate, and test.
You're now in a position to copy your model run ID, and leverage the accompanying notebook in order to extract the data using Labelbox's API. The export will contain each data row along with the accompanying annotations and the data split so you know what to train your model on versus validation and test sets.
You can follow along in the notebook provided to see how a YOLO model was trained for the purpose of identifying nuclei. The real advantage of model runs is that after you've trained your model, you can pass the predictions for your dataset back into Labelbox in order to evaluate your model performance.
After uploading your model predictions back to your model run, you can then dive into each data row in turn to observe your ground truth, versus your model predictions as shown below.

You'll see the ground truth annotations as well as the predictions from your model run, including each instance of your classes.

This gives you a more granular view of how your model is performing. You can also navigate to the metrics tab in the top right. As shown below, you will see a view of various metrics from precision recall F1, and in the case of segmentation and object detection, intersection over union (IoU).

We're now in a position to compare model inferences with your ground-truth annotations to see where the model may be underperforming. A disagreement between model predictions and ground truth labels can be due to a model error (poor model prediction) or a labeling mistake (ground truth is wrong).
After running error analysis, you can make more informed decisions on how to iterate and improve your model’s performance with corrective action or targeted data selection and additional labeling.

In some cases, it may be beneficial to go ahead and select a few of these edge case examples as anchors and then leverage the "Find Similar" feature in Labelbox Catalog. This allows you to identify where your model is underperforming on an ongoing basis, surface relevant data from across your repository that matches that type of data, and then to re-batch this data back to an annotate project for further labeling.
This allows you to be targeted in the type of data that you're surfacing and to improve your overall training data iteratively. In each case, you can retrain a custom model and within the model tab and in your experiment, you can begin to compare model runs to see each time you retrain, whether you see the intended benefits in accuracy.

As a next step, you can now begin to narrow down your data that was not already annotated in your project, and begin to layer up various filters and filter by colon tissue. You can also narrow down to a subset of our data that may be useful in order to batch label for annotation.
You can also leverage the first iteration of your model in order to accelerate this process, and deploy your model within Labelbox's Foundry and use this to generate prelabels, which can be passed to Annotate for a labeler to review and to refine if necessary.
Note: In this walkthrough, we've already deployed the custom model to Foundry. If you have any custom models within your organization that you're interested in deploying into your workspace, please reach out to your Labelbox support team.

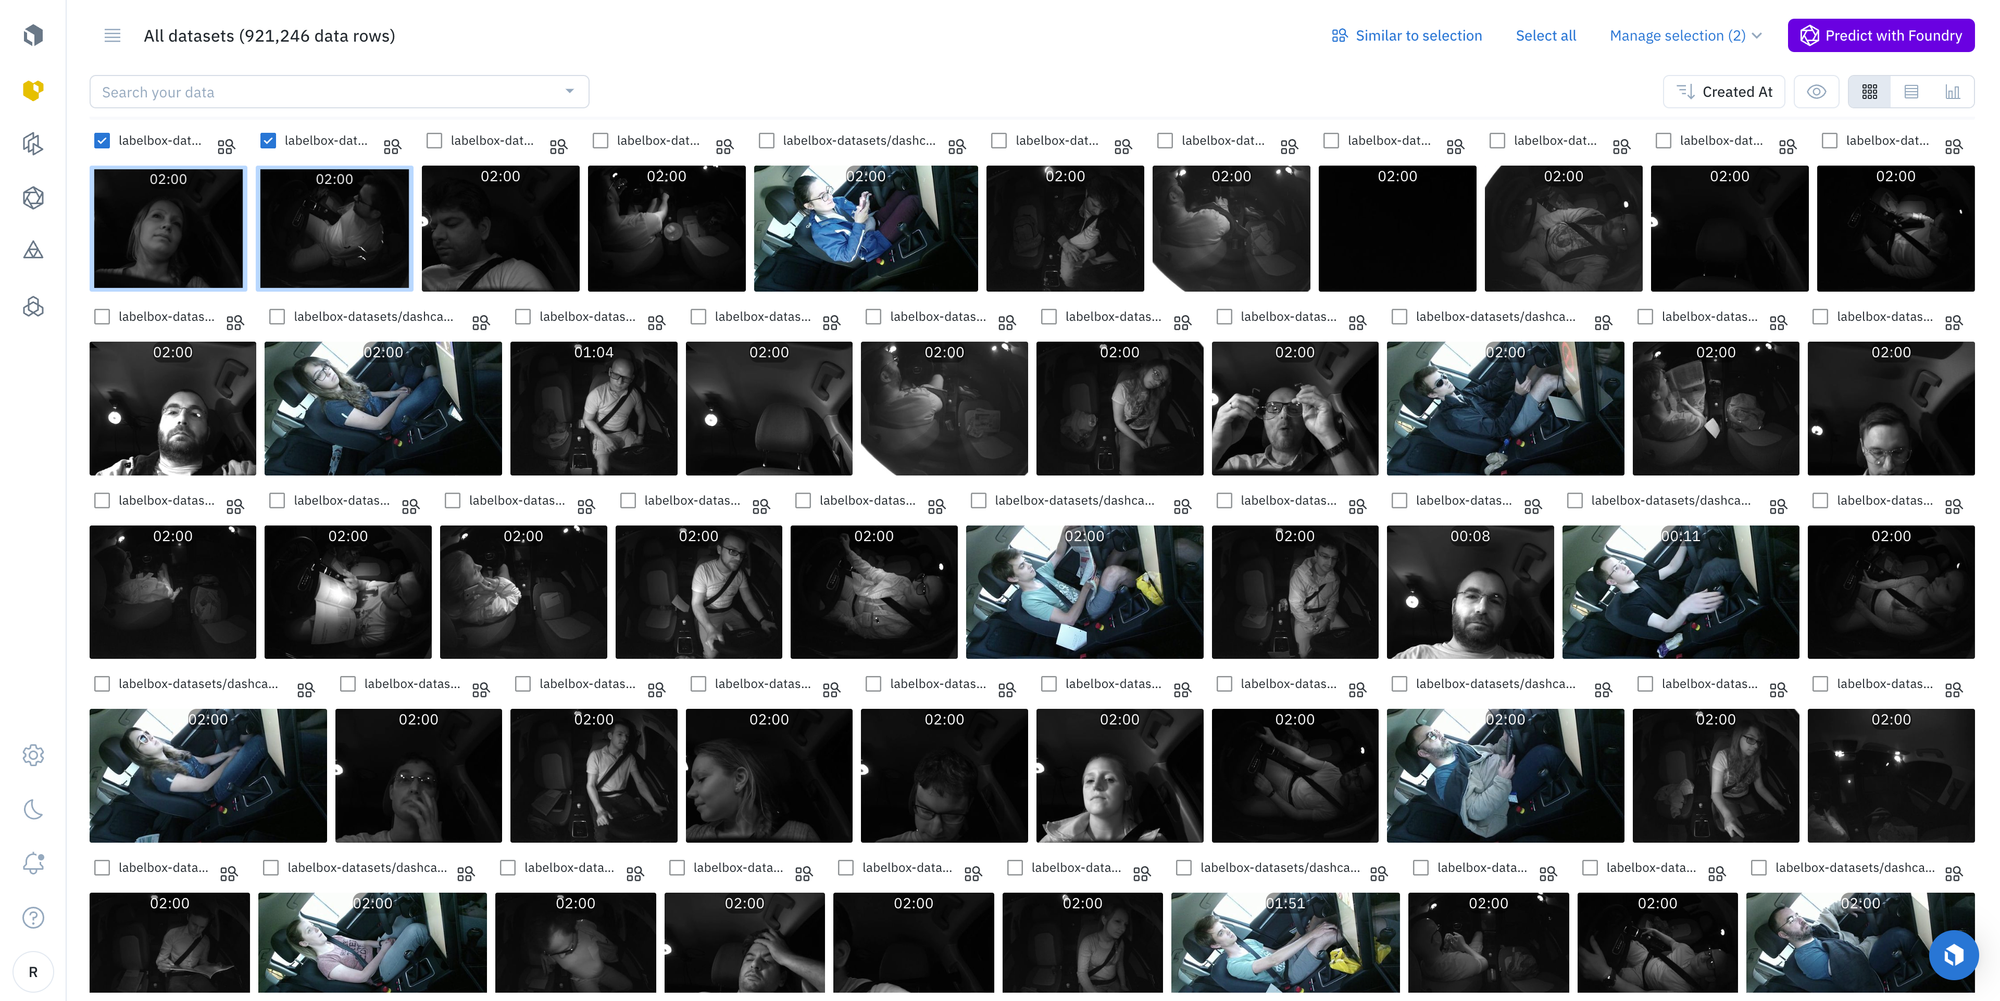
In this case, go ahead and select the sample of four hundred and select "Predict with Foundry" as shown above.

You'll see the custom YOLO-V8 model that we have trained as part of the accompanying notebook. This allows you to proceed to the model run UI where you can configure your ontology, as well as various parameters of our model run. You can also save this as an app for repeatability in the future, or you can generate previews on a sample of five or less to see how your model is performing as shown below.

In this case, we're fairly confident that the model will perform as expected for this particular iteration, so you can go ahead and submit this as a full model run.

You'll need to wait a few moments before this is complete. Once your model run is complete, you can navigate back to your dataset within Catalog, and filter for your model run which narrows down to a subset of your data for which nuclei were detected (in this case roughly three hundred). Next, select all of these data rows and you can leverage the "Send to Annotate" feature to include these model predictions.

A reminder here to do a bit of mapping to ensure that the ontology is properly mapped. To confirm, you'll get a green confirmation and see your model predictions match up with the ontology that's assigned to your project.
Afterwards, you can select the stage of your project that you want to send this to, whether it's straight to an initial review task or an initial labeling task. In this case, you'll want your labeling workforce to both validate and add where any nuclei that may have been missed. You can then navigate back to this particular project, and after a few moments, you can refresh and see your data rows passed into your project.

Once your data rows have been successfully passed to your project, they now sit within the "to label" tab. When a labeler steps into the labeling UI, they will now see the model predictions, as shown above, outlined as pre-annotations. You can add additional segmentation for any nuclei that have been missed by your initial model.
Once appropriately annotated, you can go ahead and click "submit" and you'll now have all your pre labels showing over several nuclei of interest which can be simply validated, as shown below.

This wraps up part 2 of our guide on how you can leverage Labelbox Model to evaluate each of your model iterations, as well as speed up each iteration via Labelbox Foundry to accelerate subsequent batches of data labeling.
Conclusion
By automating the ability to analyze high-volumes of medical images with AI, Labelbox provides valuable human-in-the-loop insights for a variety of diagnostics and detection use cases. This gives leading healthcare and life sciences organizations the ability to dramatically improve medical imaging for better efficiency, accuracy, and diagnostic capabilities.
Labelbox is a data-centric AI platform that empowers teams to iteratively build powerful computer vision models. To get started, sign up for a free Labelbox account or request a demo.